
JunkTrack
Free floating GPS devices to track and study litter in freshwater and coastal areas for months or years.
Developed with

JunkTrack: a system for tracking floating waste
JunkTrack is a system that allows you to monitor the movement of floating plastic waste in rivers, lakes and seas. It works thanks to small tracking devices (trackers) inserted into containers that simulate the behavior of waste in water.
How does it work?
Trackers: The trackers are equipped with long-life batteries (2-4 years) and use GPS/Galileo systems to determine their position. They send this information several times a day to a central server.
Data transmission: The position is transmitted via the cellular network. When possible, the tracker also sends information about the cell tower it is connected to.
Types of trackers:
"Basic" tracker: More economical, it sends the position at scheduled intervals and when it finds a signal. Ideal for rivers and coastal areas.
"Advanced" tracker: Equipped with internal memory, it saves positions when there is no signal and sends them as soon as possible. Recommended for areas with potentially poor GSM coverage, river beds, estuaries and at-sea.
Server and software: A central server collects and organizes the data sent by the trackers. Dedicated software filters valid data and archives it. The system allows you to graphically display the path of the waste over time.
JunkTrack is an original project developed by NAUTA scientific in collaboration with NaturalGIS (www.naturalgis.pt).
Cost
Reference pricing for map-server setup, 10 (TEN) "advanced" trackers with on-board memory, international coverage with multi standard SIM card, expected battery life of over 2 years with two positions per day: € 6000,00 plus applicable taxes. Quantity discounts available.
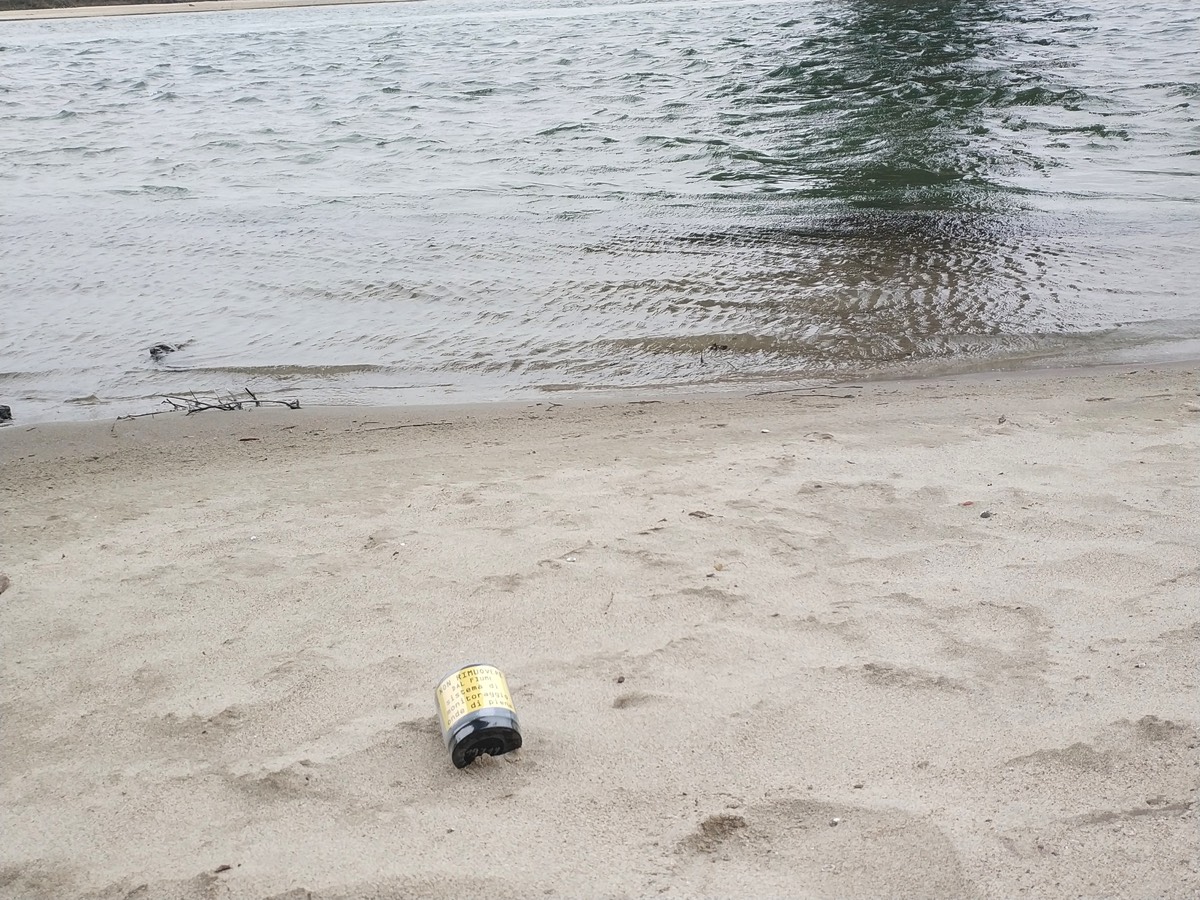
The systems, consisting of sealed containers with PET casing, can be kept in a 'hibernation' condition using an external magnet.
As well as directly tracking waste floating in the current, if they are buried in the sediment of the embankments they can assess the erosion of the embankments themselves, waking up, and sending an alarm, only when they are freed from the sands.
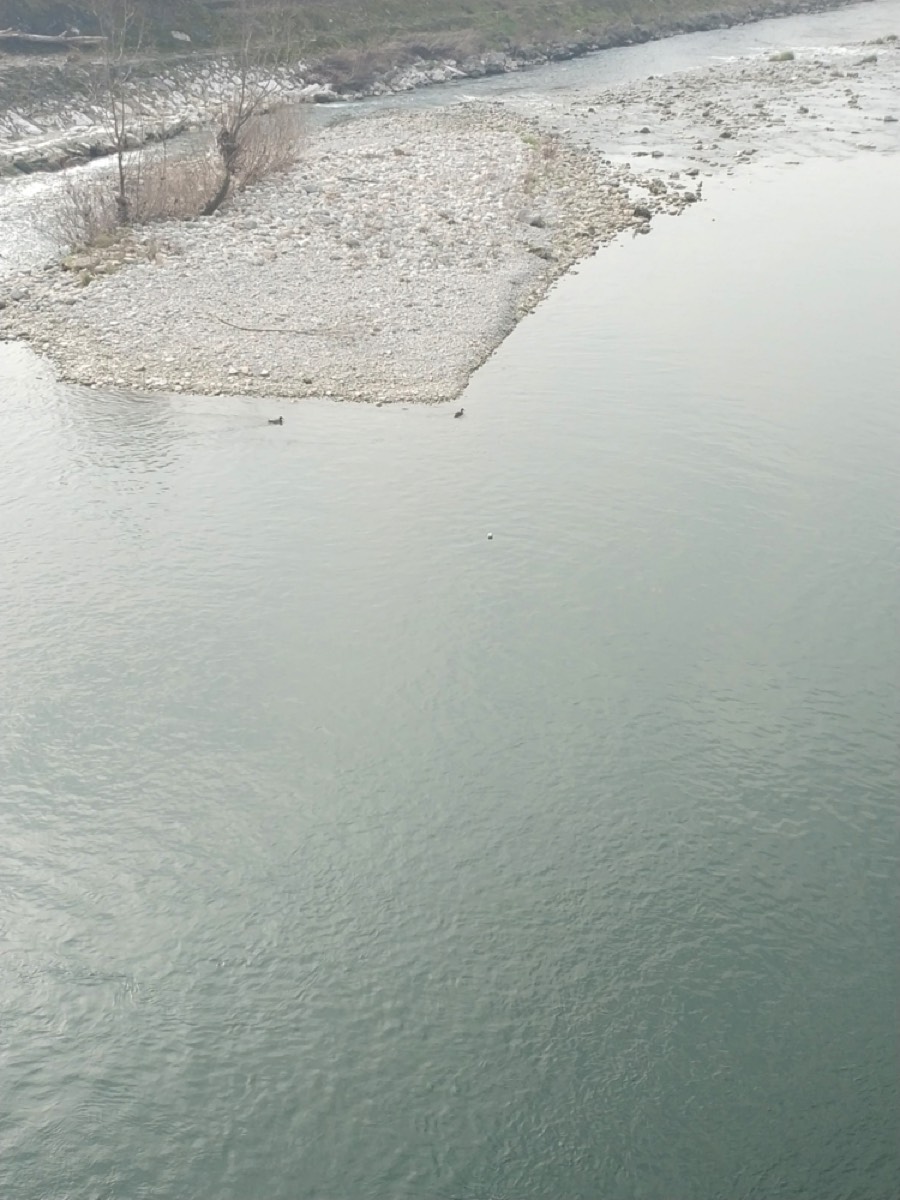
The transponders, with dive profiles varying from a few centimetres upwards, follow the flow of the water and the winds and tend to run aground and accumulate in the shallowest areas and where the current is diminishing.
They tend to start up again when the water flow increases due to rainfall, the seasons and/or the regulation of artificial hydraulic weirs.
Monitoring these phenomena is important for assessing the floating load that is displaced by the waters and ends up in the sea, if not otherwise intercepted, at river mouths.
Considering that the transmitters are free to move in the water following currents and airflows on the surface (according to current observations the behaviour is very much affected by the direction and strength of surface winds), and that often the river bed runs by its nature embedded in the plain, sometimes far from cellular coverage, the data flow from individual transmitters can be intermittent, either due to lack of coverage or due to a temporary buoyancy in the water that prevents the GPS position from being received correctly.
Despite these two limiting factors, we are able to reconstruct the sequence of transmitter positions, identifying accumulation points and average speeds in the different sections.
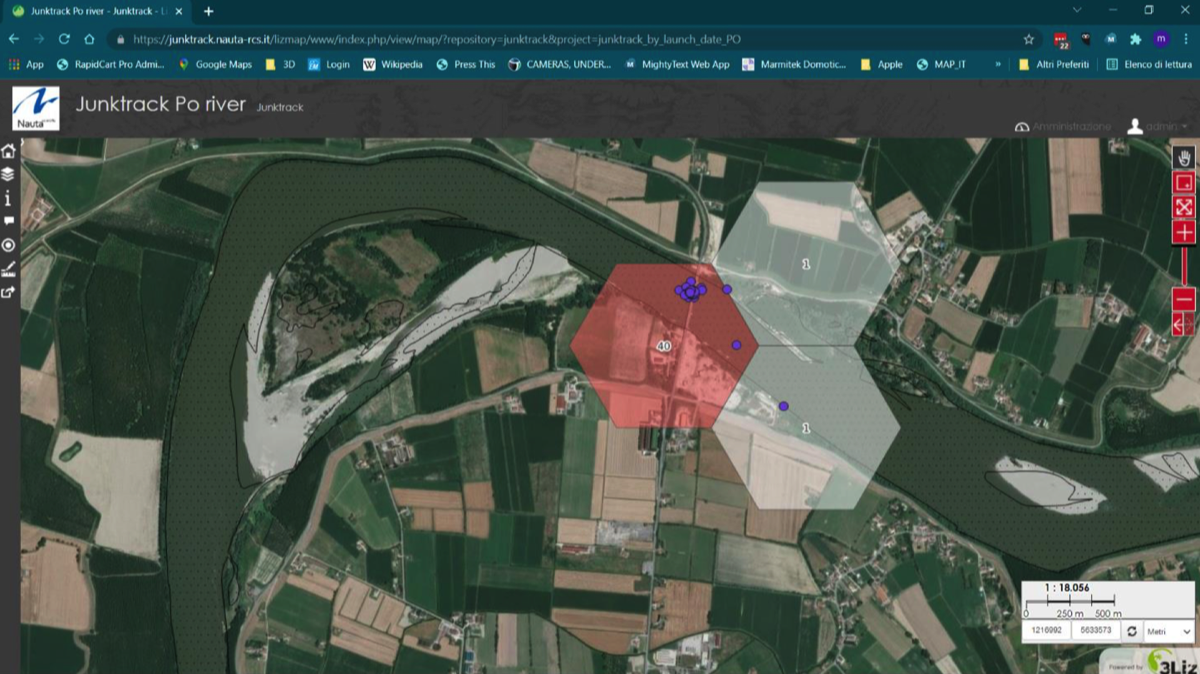
The data representation system
The data are represented using an open-source map-server provided by NaturalGIS. The server is programmed to divide the river area into hexagons. The internal colour of the hexagon is determined by the total number of points that are surveyed within it. This number, i.e. the number of times an object has been detected within the boundaries, is also expressed in figures.
The size of the hexagon is scaled as a function of the zoom at which it is displayed, in order to improve the granularity of the data.
The choice of the hexagon as the cell shape derives from the more homogeneous distance between the centre and the periphery compared to the square.
The GIS allows at the moment to switch on/off the points of each launch, switch on/off the cells, switch on/off the tracks with the sequence of points of a single (or all) transmitters.
The map background can be chosen from several standards, including satellite photography.
The system loads and regenerates the complete list of points every night, and also automatically generates some auxiliary files including formats digestible by other GIS and Google Earth.
In the development project of the data analysis system we intend to represent in greater detail the components "time", "environmental variables", "speed".
In other words, we are interested in being able to represent the average speed of the trackers as a function, for example, of the flow rate during the period, seeing the evolution of the phenomenon over the weeks.


The cartographic organisation of the information and the creation of the reports was designed and implemented by
NaturalGIS LDA - Sistemas de Informação Geográfica, Portugal
NaturalGIS LDA - Sistemas de Informação Geográfica, Portugal
The data is organised daily to create interactive maps displaying position data, historical tracks and processing that can be programmed into the database.
The maps can display average speeds along the route, accumulation points, relationships with river regime, rainfall and all other relationships that can be identified on a geographical and temporal matrix.
The maps can display average speeds along the route, accumulation points, relationships with river regime, rainfall and all other relationships that can be identified on a geographical and temporal matrix.